antipode
Published:
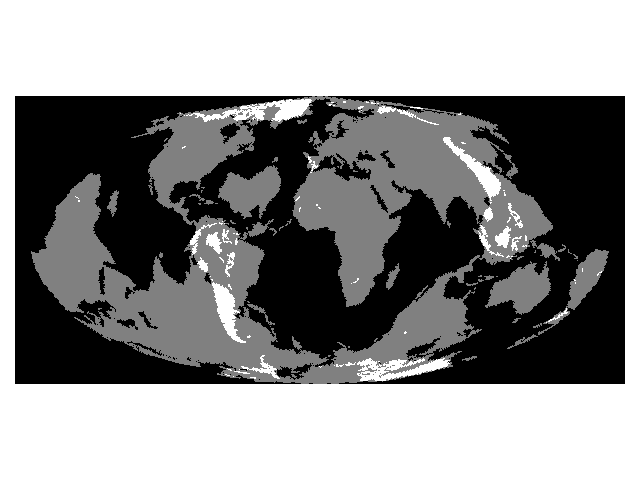
Antipodes of a sphere are pairs of points separated by the diameter, i.e. for the Earth, you can reach the antipode of your location by drilling through the center all the way. Suppose you’re standing somewhere on land (about 30% of the Earth surface area) and you wanna know the probability for you to end up on land on the other side? Following script approximates this using maps generated through geopandas package. 
The plain map depicting just land and water is obtained through the ‘naturalearth_lowres’ dataset (don’t think I saw one for coastline). It returns boundaries for each country, but it can be suppressed by assigning the same color to both color and edgecolor for each polygon. Since it would be easiest to get the final fraction by counting pixel intensities in a 2/3D image array, we would need to produce the image arrays based on an equal-area projection (like Mollweide).
While creating different projections is easy in geopandas, I couldn’t find a reliable way of shifting the center of a projection only except in Mercator. And so my work-around was to shift the projection first in Mercator for a given angle, and then re-project in Mollweide. Here I note that when assembling a dataframe from scratch its coordinate reference system (crs) has to be explicitly assigned, especially if you later wish to re-project in a different system (Mercator=’EPSG:4326’, Mollweide=’ESRI:54009’).
Also I couldn’t find a way to directly export plotted geopandas objects into a 2/3D array. My workaround was to literally save the plot without any padding and re-read the image as numpy array. We lose the native coordinates, but it doesn’t matter for our case since we will be just counting pixels by their intensities.
Overall, the script creates two Mollweide projections where one of them is shifted by 180 degrees and co-axially flipped. Each projection is ultimately represented as a grayscale 2D array with land and water having uniform intensities of 0.5 and 0 respectively. When these are added together, the combined image will have pixel values of 1 wherever antipodal points both occur on land. Running the script gives:
probability of antipode being on land: 0.150
and according to wiki it is indeed 15%; in short, it is the consequence of most of the land mass being clumped in one hemisphere.
import geopandas
import matplotlib.pyplot as plt
import numpy as np

from shapely.geometry import LineString
from shapely.ops import split
from shapely.affinity import translate


def shiftMercator(shift, world):
    """
     shifts given Mercator projection (world) by angle (shift)[degrees]

     returns geopandas dataframe in Mercator system
    """

    shift -= 180
    moved_map = []
    splitted_map = []
    border = LineString([(shift,90),(shift,-90)])
    for row in world['geometry']: splitted_map.append(split(row, border))
    for element in splitted_map:
        items = list(element)
        for item in items:
            minx, miny, maxx, maxy = item.bounds
            if minx >= shift:
                moved_map.append(translate(item, xoff=-180-shift))
            else:
                moved_map.append(translate(item, xoff=180-shift))
    gdf = geopandas.GeoDataFrame({'geometry': moved_map})
    gdf.crs = 'EPSG:4326'

    return gdf


def getMollweide(mol, flip=False):
    """
     obtains a single channel image from input Mollweide projection

     returns 2D numpy array with land=0.5 and water=0
    """

    # saving and opening the image is a workaround to extract
    # a sample normalized channel
    fig, ax = plt.subplots(tight_layout=True)
    mol.plot(ax=ax, color='gray', edgecolor='gray')
    ax.set(ylim=[-9.e6,9.e6], xlim=[-1.9e7,1.9e7])
    ax.axis('off')
    plt.savefig('tmp.png', bbox_inches = 'tight', pad_inches = 0)

    img = plt.imread('tmp.png')
    plt.close()
    channel = img[:, :, 0]
    vals = np.unique(channel)
    channel[channel > vals[0]] = 0
    channel[channel > 0] = 0.5

    # flip both axes for upsidedown image
    if flip:
        channel = np.flip(channel)
        channel = np.flip(channel, axis=1)

    return channel


world = geopandas.read_file(geopandas.datasets.get_path('naturalearth_lowres'))
mol = world.to_crs('ESRI:54009')
# land=0.5; water=0
imgUp = getMollweide(mol)

# shifting in Mercator before projecting is a workaround for
# shifting directly in Mollweide
worldShifted = shiftMercator(180, world)
molShifted = worldShifted.to_crs('ESRI:54009')
# land=0.5; water=0
imgDown = getMollweide(molShifted, flip=True)

# when added antipodes falling on land will get a value of 0.5+0.5=1
combined = imgUp + imgDown

fig, ax = plt.subplots(tight_layout=True)
ax.imshow(combined, cmap=plt.cm.gray)
ax.axis('off')
plt.savefig('antipode.png')

intensity, count = np.unique(imgUp, return_counts=True)
# counting all pixels with 0.5
allLand = count[np.where(intensity == max(intensity))[0][0]]

intensity, count = np.unique(combined, return_counts=True)
# counting all pixels with 1
antipodeLand = count[np.where(intensity == max(intensity))[0][0]]

print(f' probability of antipode being on land: {antipodeLand / allLand :.3f}')

